Writing, Analytics and Analysis
You’re either running on data or running on intuition.
If you have good intuition and a potent team, then you’re going to do very well. The crux is that you can’t measure your intuition without data, so–even if you happen to be making great decisions– you’re running on ego.

That crux applies recursively to using data to understand traffic and usage; if you have good intuition about using data, then you’re going to do well, but otherwise you’re going to need data on your usage of data.
That’s a quandary. Instead, let’s talk about analytics.
Analytics as Context for Visitors
Content creators on the internet tend to enjoy complete information asymmetry with their readers: the author knows everything, and the reader knows nothing. For the subset of publishers who have thought about this situation, I suspect many prefer the asymmetry because On the Internet, nobody knows you’re a dog, and they don’t want others to know how much time they invest writing content which is rarely read. (For professional publishers, there are also competitive reasons as well.)
I’ve recently started growing a hypothesis: sharing useful analytics data with readers can improve their reading experience by providing context to what they’re reading.
Just like knowing an article was published four years ago can be a warning sign, knowing you’re an early reader of an article can warn you that it may be a rough version or an unpopular source. Would your reading experience changing if you could see this site’s pageviews for the last week?

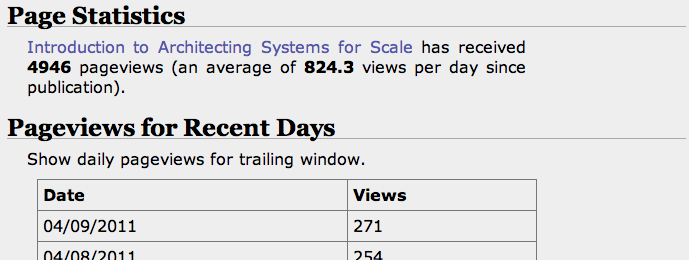
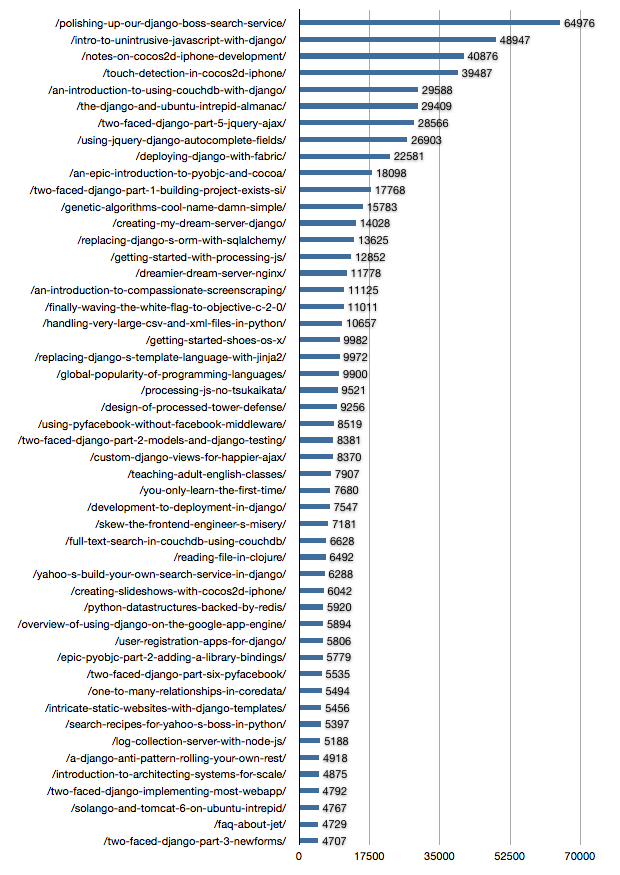
What if you could see the top referrers, and top content as well? Over the weekend I’ve cobbled together an analytics system on this blog, and have begun exposing that data and more at /analytics/.
If you’re primarily interested in understanding the lifecycle of individual pieces of content
(and studying the pickup or lack of pickup of content is, without a doubt, the most interesting
of endeavours for the journeyman publisher), you’ll need a different lense for studying the data.
With that in mind, analytics for every article on this site is available by prepending /analytics/ to its URL.
For example:
/introduction-to-architecting-systems-for-scale/
becomes
/analytics/introduction-to-architecting-systems-for-scale/
Currently you can find some rolled up statistics, pageviews on recent days, and top referrers for that piece of content. More will probably come in time.

I also plan to start trickling the information into right column modules, but am still in the thinking stage for that piece of the experiment.
Data Sources
The analytics data has come from three sources. First, a four year archive of data from Google Analytics. Next, I extracted the data from Nginx access logs for the time period since I [relaunched this blog without Google Analytics](Irrational Exuberance’s Third Rebirth). Finally, I’ve also added real-time tracking for events occuring since I rolled the tracking mechanism out yesterday.
The access log parser and real-time event parser share a couple of basic mechanisms for filtering out automated traffic, which so far have done a reasonable job of keeping traffic levels steady from switching off Google Analytics to the homebrew system. The mechanisms are:
- a blacklist of user-agents to ignore,
- ignore all user-agents which have a case-insensitive match for the string
bot, and - only count the first action per IP per minute, such that even if a bot is missed,
the impact of its bursty behavior will be mitigated. (This is implemented using
Redis’s
watch,multiandexeccommands and checking the existance of a timebucket key.)
Automated behavior which is not on the blacklist, doesn’t include bot in its user-agent
and throttles requests to one per IP per minute will indeed still be counted, but I’m interested
in directionally correct analytics so I can study content uptake and usage, I don’t really care
too much if some automation gets through.
Fours Years of Data
As part of consolidating data from the various data sources I decided to put together a few graphs showing the culmination of this blog so far.
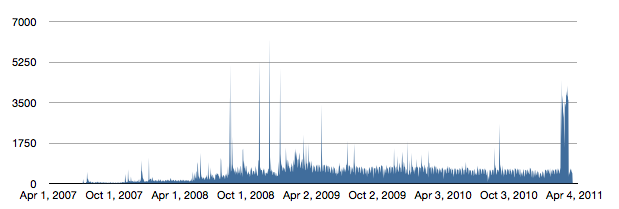
First, here are the daily pageviews from the beginning.

What impresses me most about this graph is the resiliency of traffic since I stopped writing frequently a couple of years ago (coinciding with work starting to get crazy, and mostly staying crazy since).
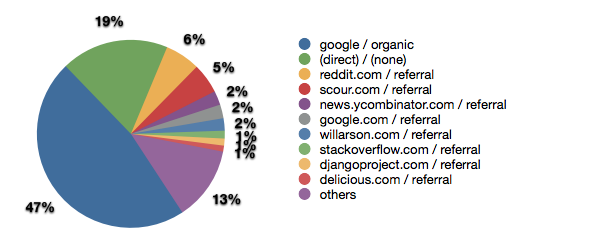
Next, popular referrers are none too shocking.

When I was last writing frequently, it was generally my impression that only social news aggregators (particularly Reddit Programming and HackerNews for the niche I operate in) generated traffic spikes.
Looking at the analytics for a recent entry, I’m curious to see if Twitter and Facebook can outduel aggregators even for niche technical content. (My hypothesis is that a fair amount of direct traffic is coming from native Twitter clients which don’t have any referrer set, but it’s fairly hard to say definitively.)

Adding together the traffic from the last four years, Google Analytics suggested the content has accrued approximately 1.2 million legitimate pageviews. If I’d been more aggressive with advertising (assume 10 cent CPC, 1% CTR), I could have made $1,200.
Which–factoring in time spent writing–is a pretty horrible deal, but this blog did get me my first job as a developer: measure things a little bit differently and it’s paid off in spades.
The Future Beckons
With these analytics in hand, I’m really excited about starting to experiment with different formats (live JavaScript examples, book reviews, etc?) and different topics (redis, architecture, python, etc!).
Mostly, I’m glad to be writing again.