Sparklines in Javascript With Sparklines.js
Earlier this week I spent a couple of days playing with the idea of sparklines, and ended up making a JavaScript library for generating sparklines in the canvas element. Because I've been using it a bit recently, I used Processing.js to handle the visualization.
Features
The site has about a dozen different examples of how you can combine and create different configurations for sparklines, but I'll do a quick rundown here.
- Can create bar or line sparklines.
- Can clearly demarcate percentiles (where 0.25 is Q1, 0.5 is the median, and so on, but you can also chose to indicate arbitrary percentiles instead).
- Can clearly demarcate arbitrary values (perhaps wanting to show lines at 70 and 80 to emphasize the number of students receiving a C on an exam).
- Can fill in the background between two lines, further emphasizing the range between them.
- Can configure padding around edges, all colors, space between bars on bar graph, etc.
- Designed to work with arbitrary datatypes, where you write a function to extract heights from it.
- Adapts to the height and width of the canvas it is given: you can shrink them down or blow them up, and they'll do their best to display their data.
(Sorry that the examples below are actually jpg's from screenshots of the canvases instead of the actual canvases themselves, you can see the real thing on the project page. My blog setup, which I've just gotten a few ideas about improving now, isn't completely intuitive for including raw markup.)
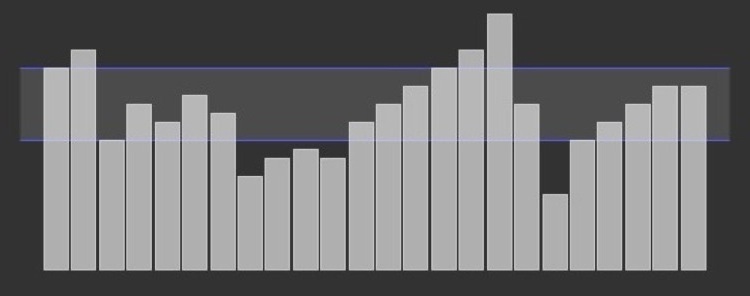
Example of a Bar Sparkline

This is one of my favorite bar sparklines.
var data3 =[120,130,80,100,90,105,95,60,70,75,
            70,90,100,110,120,130,150,100,50,
            80,90,100,110,110];
var opts = {'percentage_lines':[0.25,0.75],"fill_between_percentage_lines":true,
            'padding_between_bars':2,"left_padding":30,"right_padding":30,
            'marking_padding':16};
new Sparkline('bar4', data3).draw();
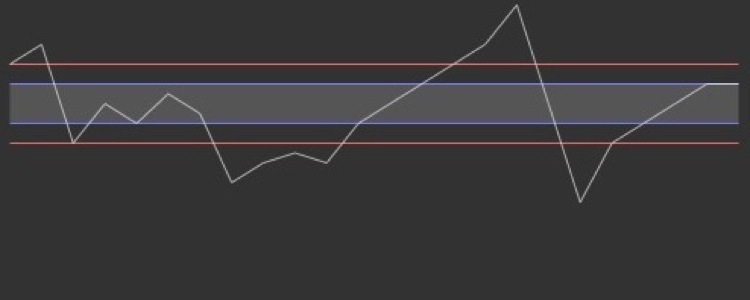
Example of a Line Sparkline

This is a line sparkline, with filled in space between lines at the absolute values of 90 and 110, as well as lines at the 25th and 75th percentiles.
var data3 = [120,130,80,100,90,105,95,60,70,75,
             70,90,100,110,120,130,150,100,50,
             80,90,100,110,110];
var opts ={"value_lines":[90,110],"top_padding":5,
           "bottom_padding":0,"fill_between_value_lines":true,
           "percentage_lines":[0.25,0.75],"percentage_color":"#FF6666"
};
new Sparkline('simple10', data3, opts).draw();
There are a number more examples, and instructions at the project page. Let me know if you have any feedback!