Navigating Private Equity ownership.
In 2020, you could credibly argue that ZIRP explains the world, but that’s an impossible argument to make in 2024 when zero-interest rate policy is only a fond memory. Instead, we’re seeing a number of companies designed for rapid expansion, learning to adapt to a world that expects immediate free cash flow rather than accepting the sweet promise of discounted future cash flow.
This chapter aims to tackle that problem head-on, taking the role of an engineering organization attempting to navigate new ownership by a private equity group. It’s an increasingly frequent scenario: after many years of learning to operate under the direction of its original founders, and the brief excitement of going public, now there’s a short runway to change operating models.
Let’s call this company Fungible Ecommerce Company. It’s a platform for supporting online commerce, and this is their Engineering Leadership team’s attempt to think through their options while waiting for new ownership to provide concrete guideposts.
This is a chapter from Crafting Engineering Strategy.
Reading this document
To apply this strategy, start at the top with Policy. To understand the thinking behind this strategy, read sections in reverse order, starting with Explore, then Diagnose and so on. Relative to the default structure, this document has been refactored in two ways to improve readability: first, Operation has been folded into Policy; second, Refine has been embedded in Diagnose.
More detail on this structure in Making a readable Engineering Strategy document.
Policy
Our policy for managing our new ownership structure is:
We believe our new ownership will provide a specific target for Research and Development (R&D) operating expenses during the upcoming financial year planning. We will revise these policies again once we have explicit targets, and will delay planning around reductions until we have those numbers to avoid running two overlapping processes.
That said, looking at our R&D investment relative to comparably growing peer set, we believe that we’ll get pressure to moderately reduce our spend. We aim to accomplish that reduction through a series of policies and one-off infrastructure projects, without requiring a major reduction in headcount spend.
We will move to an “N-1” backfill policy, where departures are backfilled with a less senior level. We will also institute a strict maximum of one Principal Engineer per business unit, with any exceptions approved in writing by the CTO–this applies for both promotions and external hires. These policies are effective immediately, and are based on our model of engineering-org seniority-mix.
We commit to this policy reducing headcount costs by approximately 5% YoY every year for the foreseeable future.
We evaluated a number of potential changes to our geographical hiring strategy, but we believe that staffing engineers with cross-functional partners (Product, Marketing, Sales, and so on) is a priority. We have not been able to reach an agreement cross-functionally, and as such we are not changing our geographical hiring strategy at this time.
If we can agree on a policy here, we could accomplish 10-20% reduction in cost over 2-3 years, but the details matter a great deal, so we cannot commit to a specific outcome until we get more cross-functional alignment.
Our infrastructure spend has grown significantly more slowly than revenue for the past two years, meaning that we’ve successfully implemented our infrastructure spend strategy of growing infrastructure costs more slowly than revenue. We will continue our current infrastructure efficiency strategy, and believe there are relatively few high impact efficiency opportunities at this point.
We commit to growing infrastructure spend at no more than 5% YoY, significantly lower than our projected revenue increase of 25% YoY.
There are two narrow infrastructure spend opportunities, both related to the integration of prior acquisitions into our shared infrastructure and away from one-off approaches. We will prioritize the post-acquisition integration work next quarter, with the goal of fully standardizing all infrastructure across the company into the stack maintained by our centralized Infrastructure Engineering team.
We commit to a one-time reduction in infrastructure of 3% YoY.
We believe there are significant opportunities to reduce R&D maintenance investments, but we don’t have conviction about which particular efforts we should prioritize. We will kickoff a working group to identify the features with the highest support load.
Diagnose
We’ve diagnosed Fungible Ecommerce Company’s current state as:
Fungible Ecommerce Company’s revenue has grown 20-25% YoY for the past two years, and our target for next year is 25% YoY revenue growth. While this is not a guarantee, we grew slower than 25% last year, it’s a defensible goal that we have a good chance of achieving.
Our Engineering headcount costs have grown by 15% YoY this year, and 18% YoY the prior year. Headcount grew 7% and 9% respectively, with the difference between headcount and headcount costs explained by salary band adjustments (4%), a focus on hiring senior roles (3%), and increased hiring in higher cost geographic regions (1%).
Based on general practice, it seems likely that our new Private Equity ownership will expect us to reduce R&D headcount costs through a reduction. However, without concrete details, we cannot yet make structured decisions. Our strategy will depend significantly on the scale of any proposed reductions.
Infrastructure engineering spend (including vendors) has grown by 4-5% YoY for the past three years. We made a significant push on reducing costs three years ago, and have grown slower than revenue since then.
There are few remaining opportunities to significantly reduce infrastructure costs, but we’ve made several acquisitions since our prior infrastructure consolidation, that represent significant potential savings: roughly one-time 1.5% YoY reductions for each of two largest opportunities.
A significant portion of our current R&D spend goes into maintaining our existing functionality, particularly functionality related to earlier geo-expansion efforts that only apply narrowly to some small markets. We suspect there’s an opportunity to reduce maintenance overhead here.
However, we lack believable metrics on both (1) time spent maintaining the software and (2) time that would be saved by these cleanup efforts. As a result, it’s hard to pitch projects of this sort as revenue saving with much conviction.
Explore
Financial markets evaluate companies in comparison to their peers. This is most obvious in public markets, where there’s significant information transparency about business performance, and sufficient liquidity to allow markets to revalue companies in something approaching real-time. While private equity firms generally take controlling interest of private businesses, or with the intent of taking the business private if it happens to be public, they value businesses in the same way.
In this exploration, we’re going to dig into two particular questions. First, we’re going to dig into a dataset on the performance of public technology companies, and then second we’re going to look into the concrete example of Zendesk, who were taken private in 2022 after being bought by two private equity firms.
Comparable companies
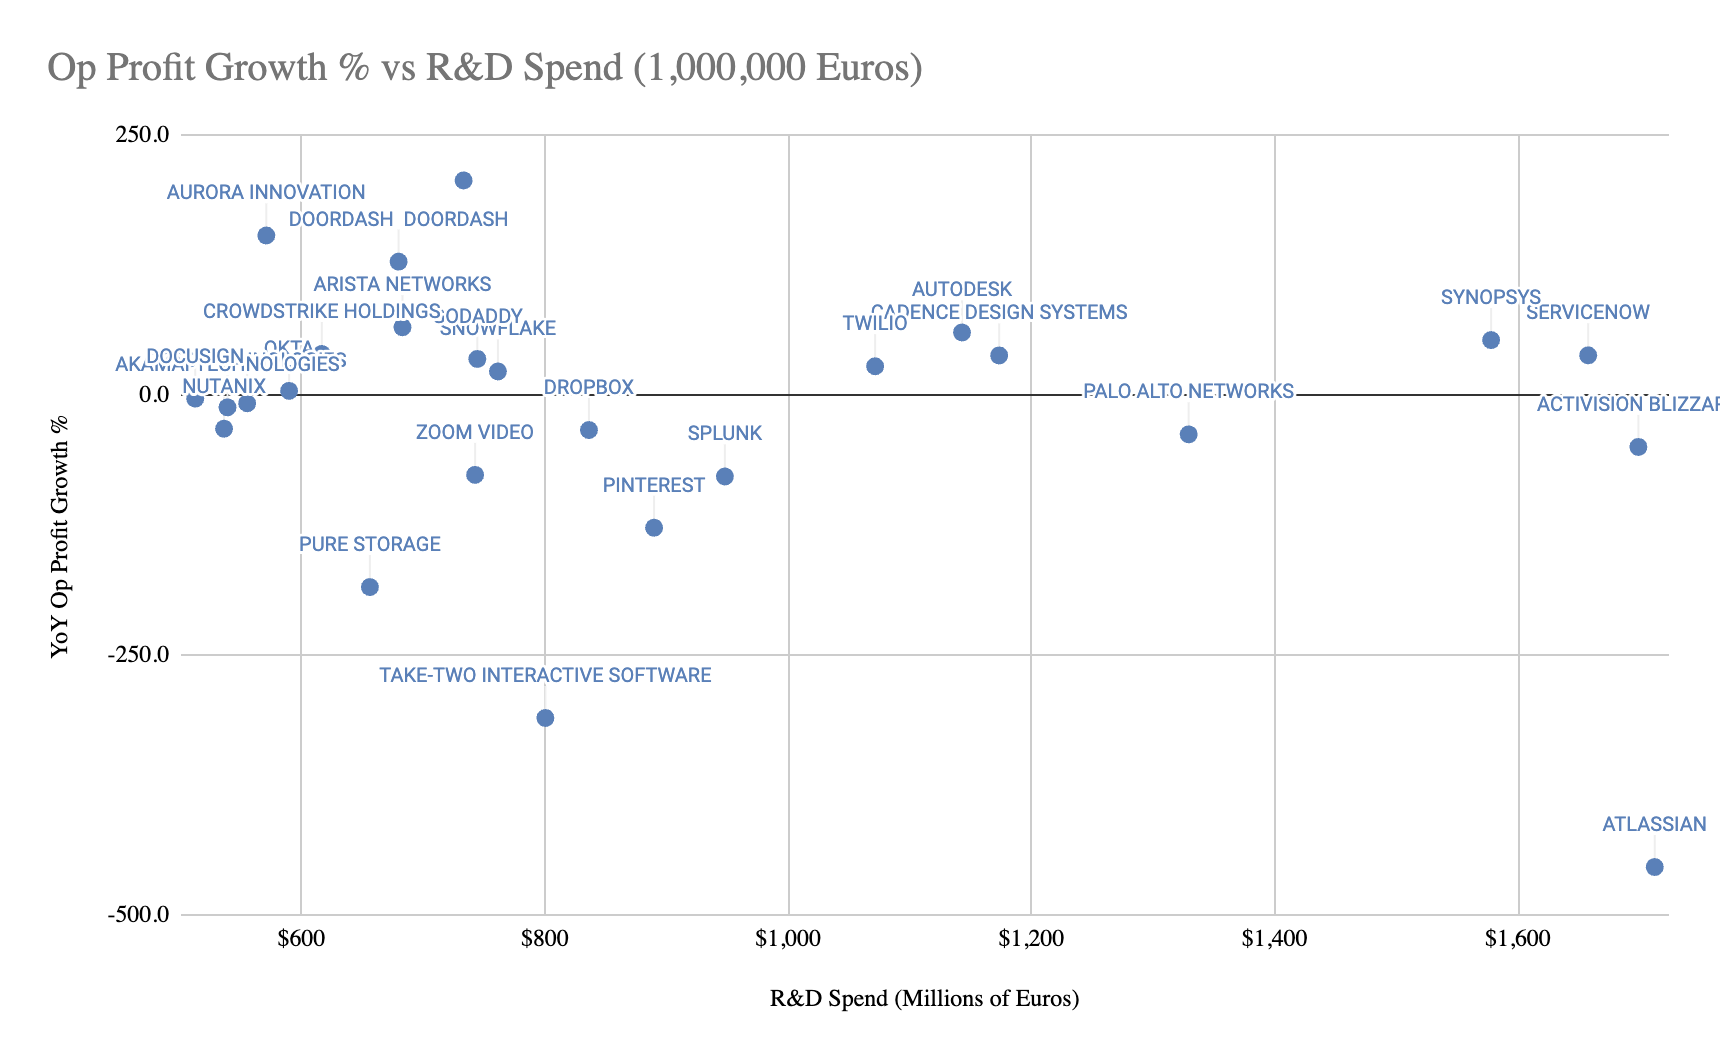
Exploring the benchmarking question first, most investors evaluate engineering within the context of the overall Research & Development (R&D) investment. They generally judge that spend by constructing a scatterplot of R&D spend versus year-over-year revenue growth for a cohort of similar companies. Perfectly similar companies don’t exist, so this cohort is generally constructed from companies in similar industries, with similar revenue, and operating in the same regions.
We have reached out to our investors to see if they can provide the internal datasets they use for this analysis, but in the meantime we’ve developed a directionally useful dataset using the 2023 R&D Investment Scoreboard, with some rough cutting of the data to remove outliers. (If we repeat this process, we will use the SEC’s EDGAR database to pull a more specifically helpful dataset, but this has been a useful starting point.)

This isn’t a perfect dataset, we prefer revenue growth over growth in operating profit, but it’s the best option within the dataset that we were able to quickly pull down. Nonetheless, there’s a clear strong performer quadrant in top-left that we can plot ourselves into to understand our general performance, which is discussed further in the diagnosis section above.
Zendesk
The second topic of exploration we dug into is understanding the general sequence of steps taken by private equity ownership after acquiring a company. For an example with available public documentation, we focused on the purchase of Zendesk in 2022.
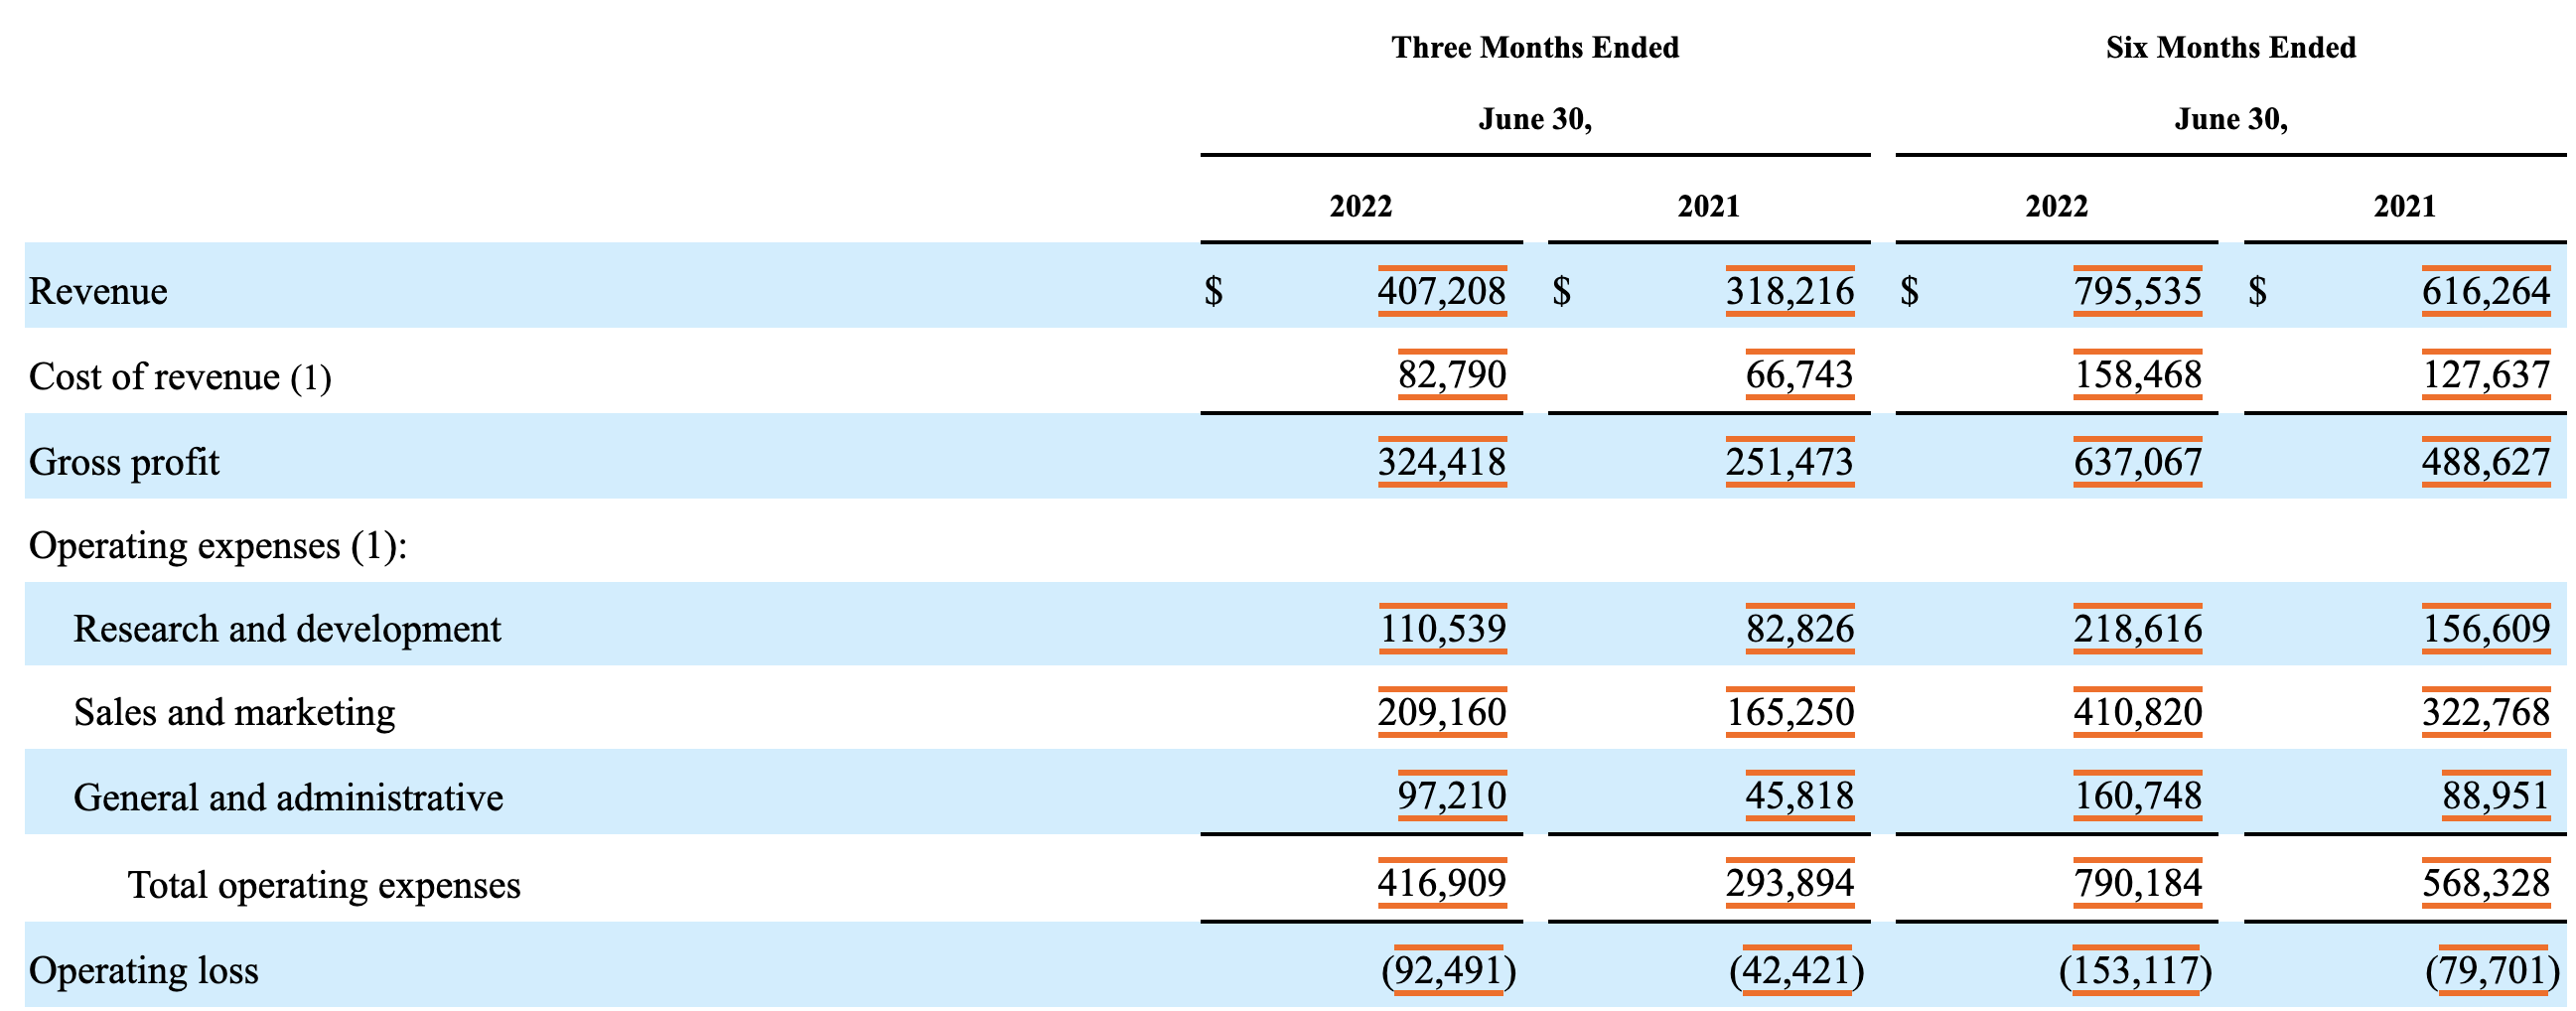
To start, we pulled Zendesk’s final 10-Q before going private.

Taking those values, we can reformat them into a chart focusing on the year-over-year changes in the 6 months period ending in 2022 versus the same period in 2021.

The changes are a bit concerning. Sales and Marketing costs have grown more slowly than revenue, which is positive, but Research and Development (R&D) expenses have grown about 50% faster than revenue, and General and Administration (G&A) charges have grown more than twice as quickly as revenue.
From those growth rates, we would assume that the new ownership might push to aggressively reduce spend in those two areas, which is indeed what history suggests happened, with a November, 2022 reduction, followed some months later by a May, 2023 reduction. It’s hard to get precise data here, but it’s our impression that these reductions focused on areas where expenses were growing quickly, with particular focus on G&A functions.