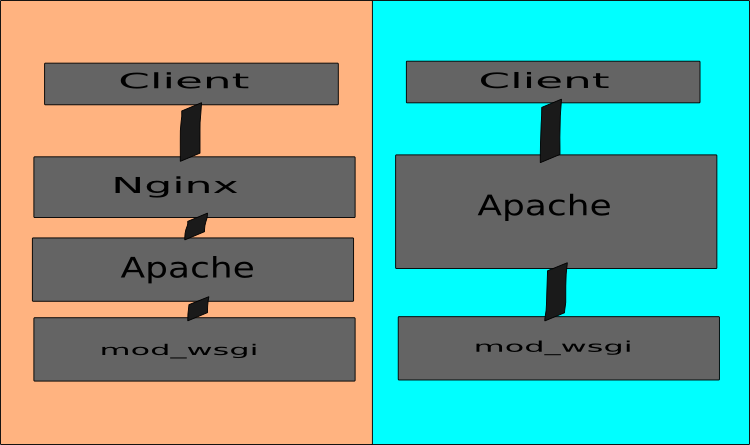
Measuring Single and Multi Server Performance
One of the eternal debates about server setup is between the multi-server and single-server configuration for serving dynamic web applications.

I decided to run some performance tests in an effort to throw some numbers at the discussion.
Testing Conditions
Before each run of the data collection script the server was rebooted, but between each test nothing was done to the machine.
There was a pause of 30 seconds between each test, each test was run three times, eight tests per configuration (from 25 concurrent users up to 200 current users, by increments of 25), and a total of eight different configuration.
All in all there were 192 tests run, half against an Apache &
mod_wsgiconfiguration, and half against a Nginx, Apache &mod_wsgiconfiguration.The raw data contains all three runs for each test, but for my charts and figures I choose the run with the highest average transactions per second.
The machine tested was a 256 megs of ram VPS from Slicehost, setup to these specifications. The machine driving the was also a Slicehost VPS. Roundtrip time between the two machines was approximately half a millisecond.
For the Nginx, Apache &
mod_wsgiexample I made no modifications to the VPS after rebooting.For the Apache &
mod_wsgitests, before rebooting I altered Apache to expose it on an external port. After reboot I SSH'd into the VPS, turned off Nginx, and then exited my SSH session.The pages being loaded were extremely lightweight. The no-database-query page was 1 kilobyte, and the database-query page was 0.4 kilobytes.
Data collection was performed using Siege and Siege were managed by this script.
Remarks on Testing Conditions
These conditions are optimal for an Apache & mod_wsgi
configuration to outperform a Nginx, Apache & mod_wsgi configuration.
The queries are extremely lightweight (good for a server with fewer worker
threads), and they are extremely fast (again, good for a server with fewer
worker threads).
These conditions should represent the perfect storm a single server setup to outperform the multi-server approach.
Results
Initially I choose to evaluate results in terms of transactions per second. A brief snippet of results will explain why that was a rather dull proposition.
| Clients | Configuration | Transactions / sec |
| 75 | nginx, apache, mod_wsgi Debug? True Db? False | 16.66 |
| 75 | apache, mod_wsgi Debug? True Db? False | 17.16 |
| 75 | nginx, apache, mod_wsgi Debug? False Db? False | 15.68 |
| 75 | apache, mod_wsgi Debug? False Db? False | 16.27 |
| 75 | nginx, apache, mod_wsgi Debug? True Db? True | 17.22 |
| 75 | apache, mod_wsgi Debug? True Db? True | 16.43 |
In terms of transactions / second, the difference in configurations (and enabling debugging, and hitting the database) had virtually no impact. Back to the drawing board.
My second approach was to compare time elapsed to server all requests. Unfortunately, elapsed time and transactions per second are calculated from overlapping data, so the differences between the two setups were essentially the same. Sometimes the multi-server setup outperformed the single server performance. Sometimes the single server setup outperformed multi-server performance. Nothing conclusive.
This trend continues throughout all of the various metrics recorded by the load-testing. Perhaps more divergent numbers could be achieved by averaging the three runs instead of taking the best value. That said, even obsessively seeking out a preference between the two in these conditions will only discover a minimal preference one way or another. For someone who views performance as a piece of the puzzle--not the puzzle itself--the value of such a data point is virtually moot.
I'm curious to see these tests replicated and done with increasingly interesting comparisons (Nginx and `mod_wsgi versus Nginx and fcgi versus Apache and mod_wsgi, etc), and possibly even this experiment itself repeated on the chance that I performed some egregious error and these numbers were in some way invalidated.
For the time being, my conclusion is that for serving dynamic content in good conditions, performance is roughly equivalent for both the single and multi server setups.
Raw Data
The raw data can be downloaded here in CSV format.
Here is the script that I used to isolate data on one metric (concurrency, time to complete, etc), pick the strongest value from the three equivalent runs, and then spit out a CSV file.
import csv
fin = open('results.csv','r')
dr = csv.DictReader(fin)
results = []
field = 'Concurrency' # 'Transaction rate'
while True:
    try:
        tests = [dr.next(),dr.next(),dr.next()]
        tests.sort(lambda a,b : cmp(a[field], b[field]))
        test = tests[-1]
        summary = {}
        summary[field] = test[field].split(' ')[0]
        summary['clients'] = test['users']
        desc = "%s Debug? %s Db? %s" % (
            test['config'],test['debug_on'], test['use_db'])
        summary['description'] = desc
        results.append(summary)
    except StopIteration:
        break
fin.close()
fout = open('cleaned.csv','w')
fields =  results[0].keys()
fields.sort()
field_dict = {}
for field in fields:
    field_dict[field] = field
writer = csv.DictWriter(fout, fields)
writer.writerow(field_dict)
writer.writerows(results)
fout.close()