Measuring developer experience, benchmarks, and providing a theory of improvement.
Back in 2020, I wrote a piece called My skepticism towards current developer meta-productivity tools, which laid out my three core problems with developer productivity measurement tools of the time:
- Using productivity measures to evaluate rather than learn
- Instrumenting metrics required tweaks across too any different tools
- Generally I found tools forced an arbitrary, questionable model onto the problem
Two and a half years later, I made an angel investment in DX, which at the time I largely viewed as taking a survey-driven, research-backed approach to developer productivity. I was recently chatting with Abi Noda, co-founder at DX, and thought it would be an interesting time to revise my original thesis both generally and in response to DX’s release of DX Core 4.
Checklist for developer meta-productivity tools
In 2024, I think this is the checklist for a world-class developer meta-productivity tool:
Pull metrics in from most vendors (e.g. Github) automatically. Support converting metrics from primary observability systems (e.g. Datadog). Support custom emitting metrics.
Automatically graph those metrics in a consistent fashion. This includes denormalizing the data across vendors, such that those relying on standard vendors do near-zero customization. (Implicitly this also means rejecting measurements that are inherently complex, looking at you, lead time.)
Plot values against comparable benchmark data, ensuring that all these values have high “judge-ability” such that you, your CTO, or your Board, can judge your company’s performance relative to peer companies.
Provide a “theory of improvement” such that you can roughly translate your scores into the projects to invest in. These should be as narrow as possible. A great example would be: 90% of your incidents involve one of these five files; you should prioritize hardening their contents.
A broader example could be along the lines of: generally teams that score highly on this dimension utilize these practices (e.g. trunk-based development), and those that score lower use these other practices (e.g. long-lived branch development).
I think if you can provide all four of those, then you have provided a highly valuable, effective tool.
Implicitly a network product
This is something of an aside, but I particularly believe that there’s an important breakpoint between products that offer only the first two (ingestion and charting) from products that offer the third (benchmarking). This is because I increasingly believe that developer data is only judge-able in the context of benchmarks, and you can only provide benchmarks if you have a network of companies sharing their data in a common place. Also, they need to be sharing it in a way where the data itself is relatively verifiable (there’s a long history of inaccurate self-supplied datasets powering products that gradually undermine user trust).
If you believe that benchmarks are foundational, then the winning generational developer meta-productivity tool is a network product, and that means that only one or two winners will exist in the exosystem. (Because only so many companies can be vendors to enough of these companies to build good benchmarks.) This is a significant shift away from my earlier thinking here, because now there’s an underlying mechanism to force this market to converge rather than remain fragmented across thousands of small vendors.
Progress from 2020 to 2024
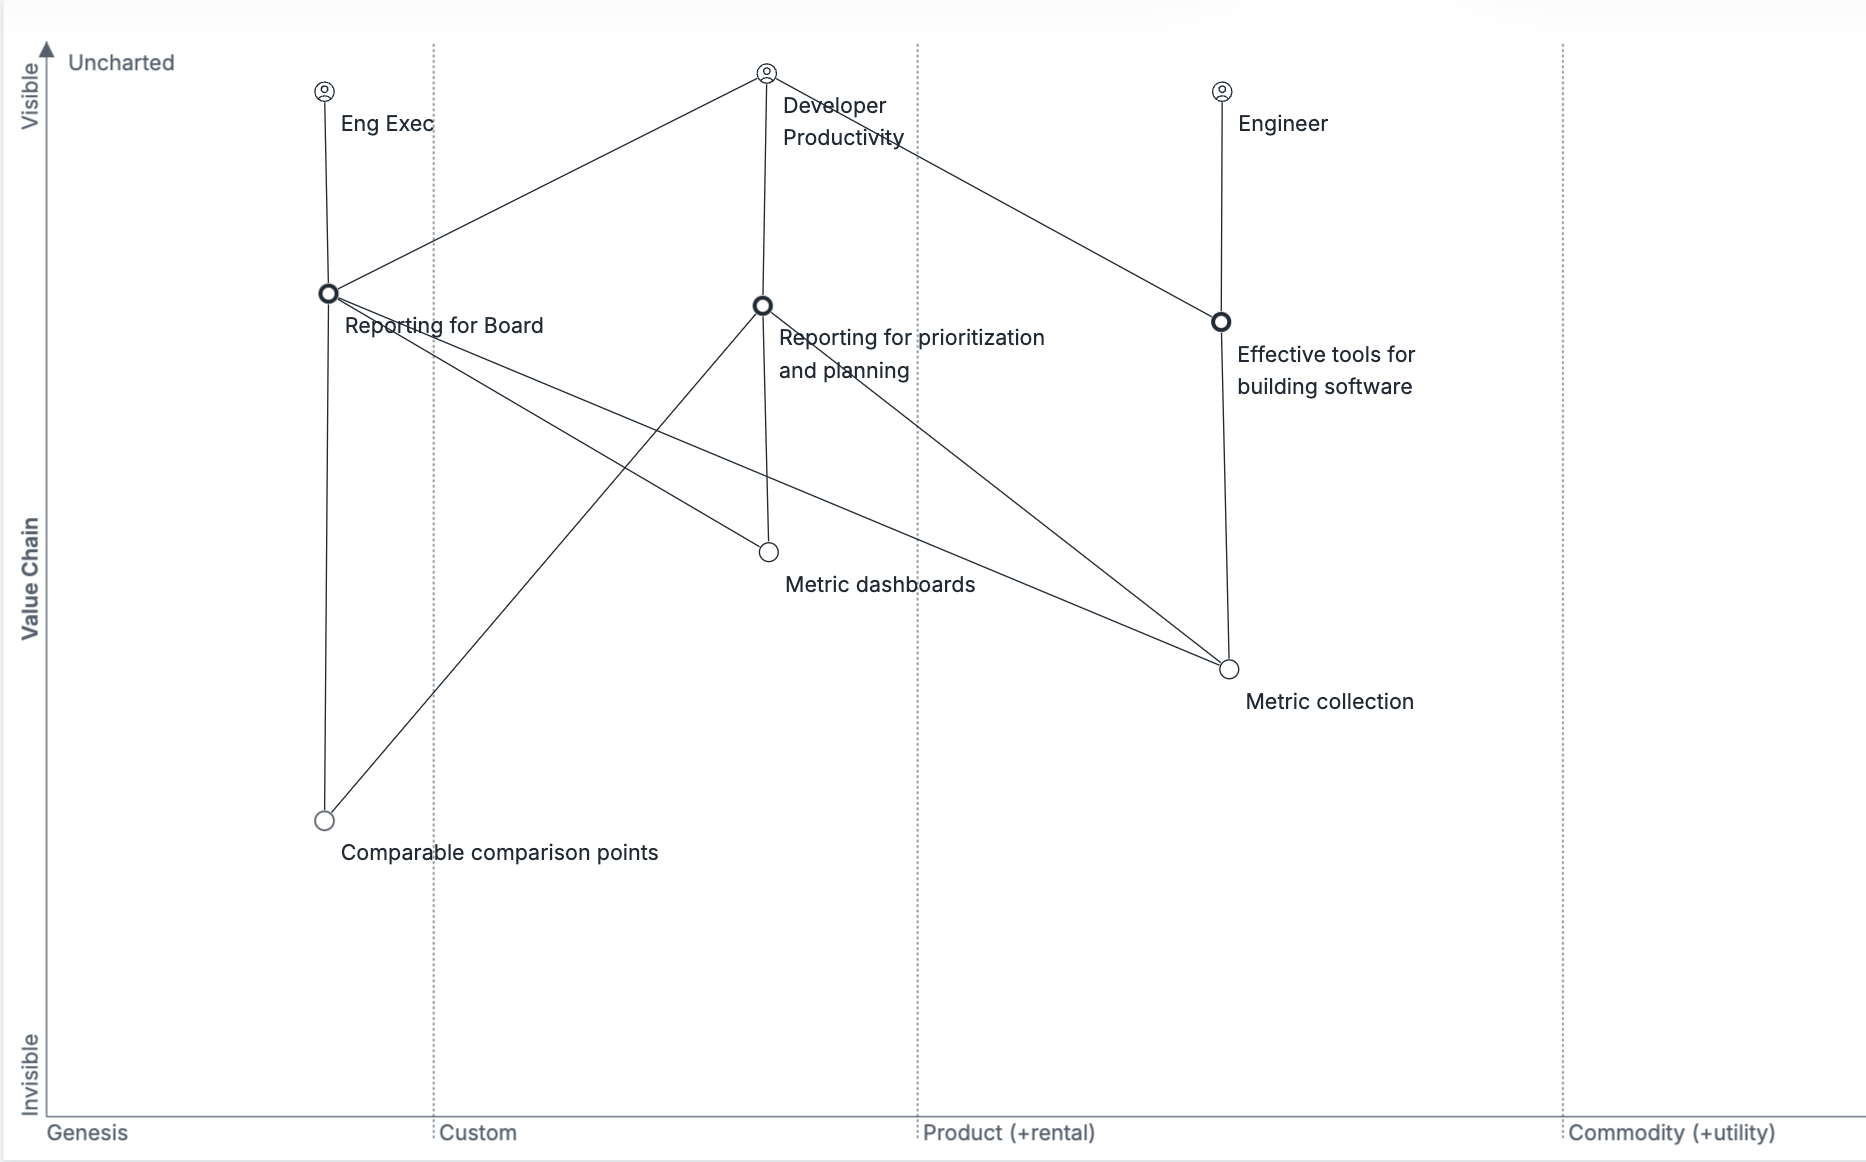
Before testing my four new criteria against recent developments in the developer productivity space, I wanted to do a bit of Wardley mapping to better explain where I’ve seen challenges in these tools, and why I think DX’s approach is relatively novel.
There are three users to consider: the engineer, the developer productivity team, and the engineering executive. The engineer just wants the developer productivity team to do useful things for them, and to spend the minimum amount of time maintaining data integrations for developer productivity. The engineering executive wants reports which help them evaluate the efficiency of their overall engineering organization, which they will use for resourcing decisions and for reporting upwards to the board on their progress. The developer productivity team wants to provide all of those services, and to make targetted investments into improving the development experience.

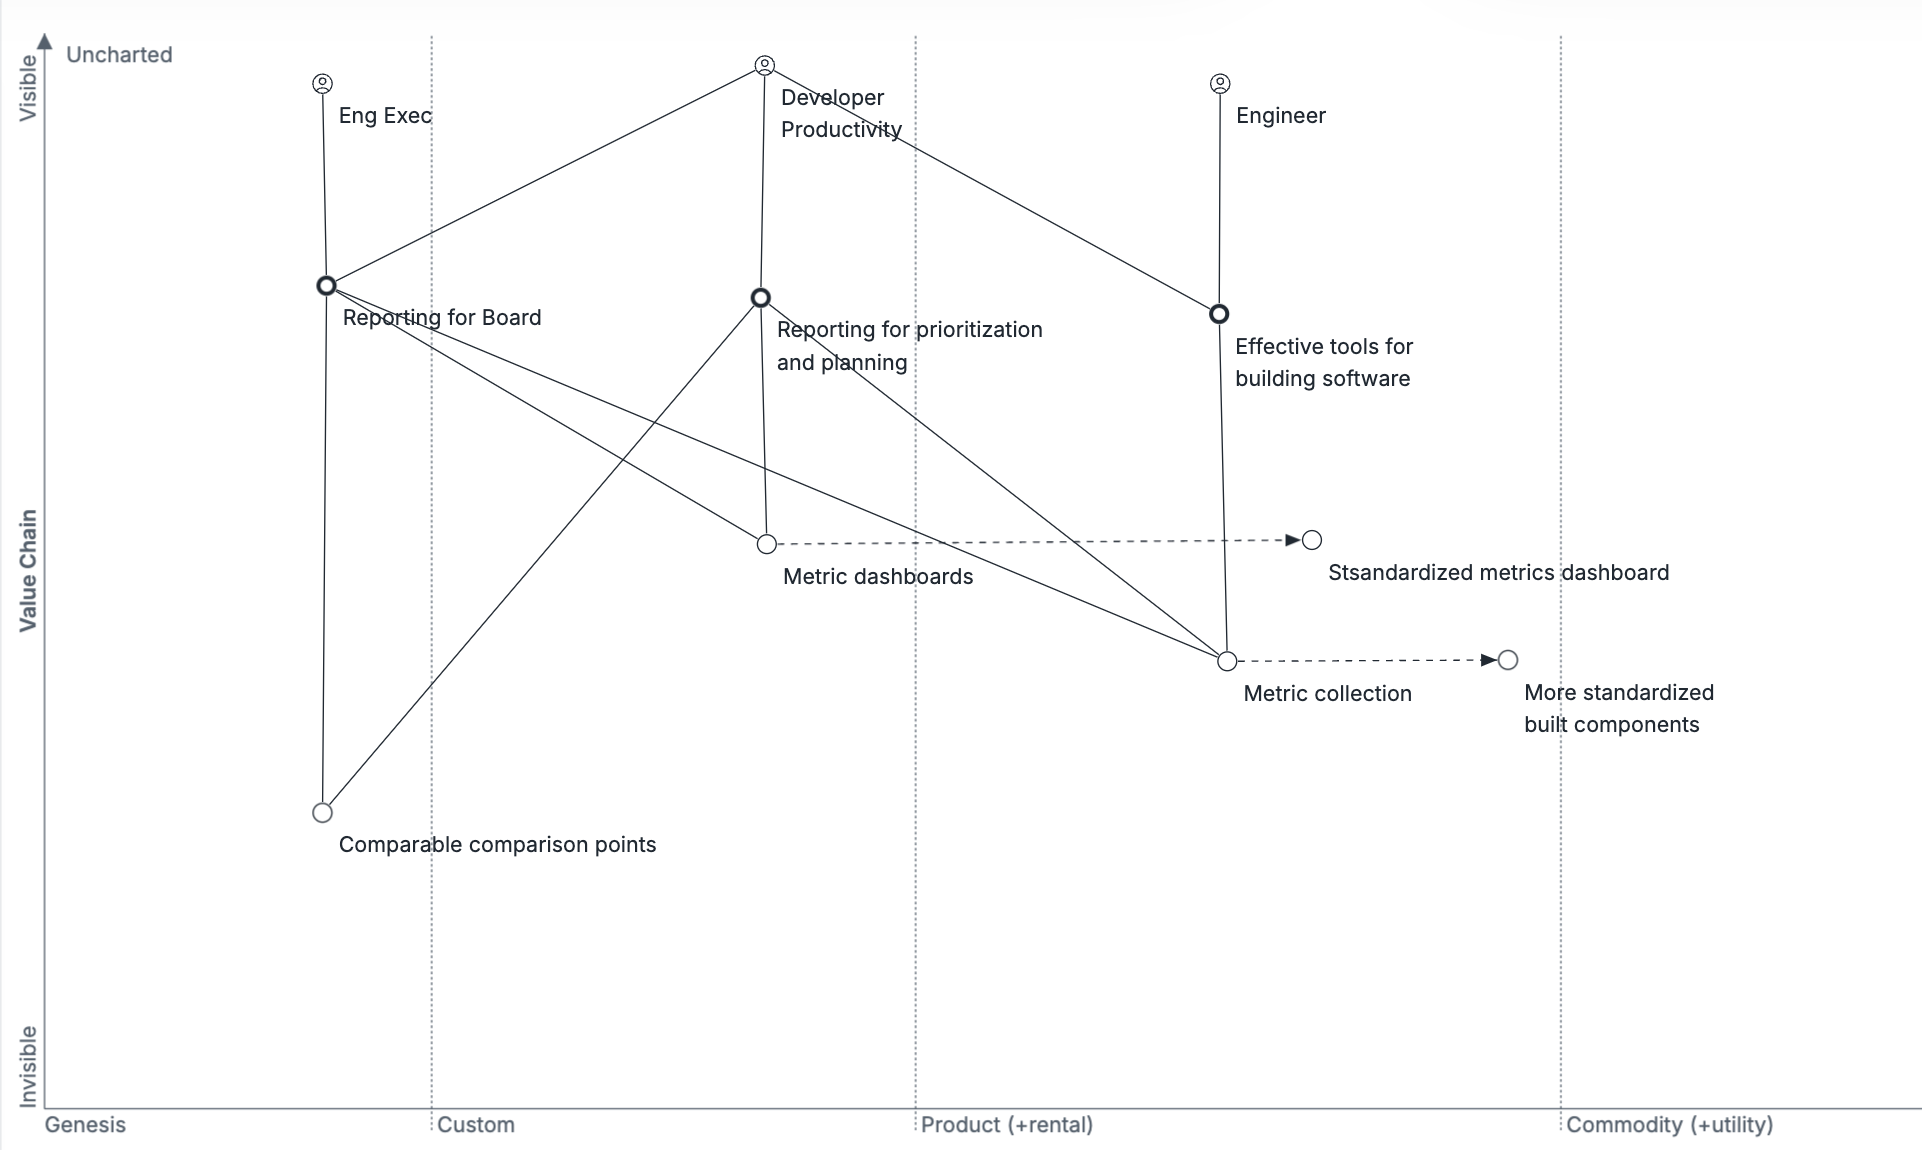
In 2020, my perspective was that dashboarding and instrumentation remained custom efforts, and that the current wave of tooling aimed to solve that problem through better ingestion of data, which brings us to this second phase of the Wardley map.

As dashboard creation and metric collection became more standardized, you would assume that these tools got significantly more valuable. This seemed like great progress, but it revealed, in my opinion, a misunderstanding about how these metrics are useful.
It’s not particularly interesting to set a goal to increase pull requests per engineer by 10% this half: there’s only so much insight you can get from trying to manipulate these lines in isolation. But it is very interesting to know that you are significantly behind pull requests per engineer of similarly sized companies. (And even more interesting to see where you fall into a scatterplot of those similarly sized companies.)
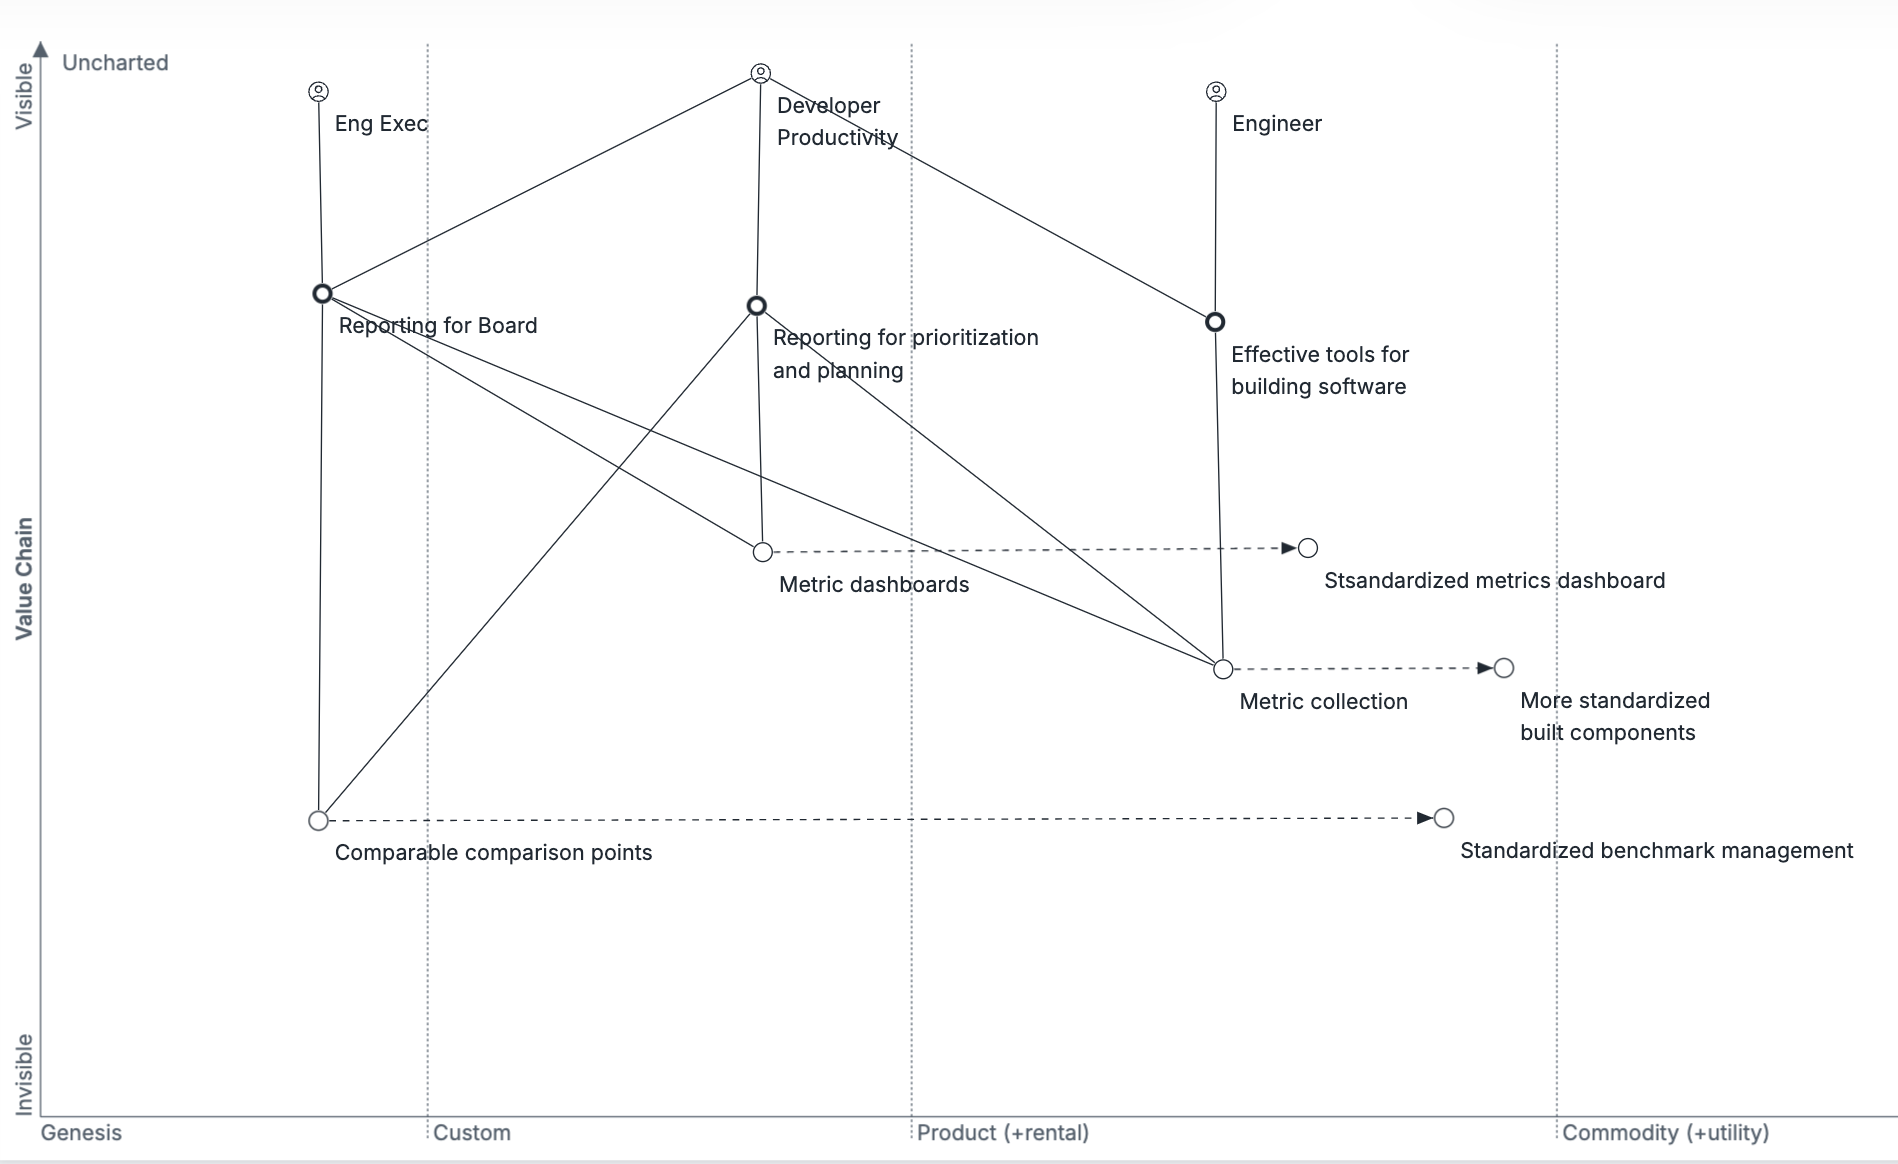
Importantly, when you think about the engineering executive, it is only the benchmarks which help them adequately report to their board about the impact of their engineering team’s execution: all the other reports don’t solve the engineering executive’s problem at all. Generally, you can provide any reasonable measure to your board, because they are more focused on ensuring you’re capable of instrumenting and maintaining something than on what you instrument itself, but with benchmarks you can actually provide a meaningful way to measure and evaluate your team’s work! And, to the extent the benchmarking is maintained by a vendor rather than something you have to collect informally from peers, it becomes easier to provide a meaningful comparison between your organization and peers than to provide something less meaningful.
The first wave of tooling vendors thought they could solve the engineering productivity problem with better dashboarding, but rather it’s the centralization of benchmark creation that’s the truly valuable part for the most important engineering executive user.

Summarizing a bit, the core insight behind DX’s approach is that standardizing the benchmarking process across companies, such that their customers can benefit from those benchmarks without collecting them themselves, is exceptionally more valuable than the dashboarding or collection components themselves. In many senses, this is applying the learnings from CultureAmp to a new space. It also means that being a standalone offering, rather than an owned component of a larger metrics platform within Google or Github, expands the addressible companies that can be included for benchmarking.
Lastly, if you accept that benchmarking is the most important feature, it means that your number one criteria for things to measure is your ability to consistently include them into a benchmark across many different companies.
Should metrics provide a Theory of Improvement?
The biggest reason I love benchmarks is that any metric with good benchmarks has high judge-ability. Judge-ability is whether you can judge if something is going well by understanding the value over time. Almost all metrics meet this criteria if you show your value for that metric within in a scatterplot of values for peer companies. For example, DX Core 4 suggests “diffs per engineer” as the metric to evaluate engineering speed, and while this is an extremely hard metric to evaluate in isolation, it’s very easy to look at your organization’s diffs per engineer against peer companies’ diffs per engineer and make an informed judgment about whether things are going well for you.
Conversely, I’m much less confident that the goal-ability of diffs per engineer is high. Goal-ability is whether you can usefully set a target based on changing your current value. For example, we’re showing 2.5 diffs per engineer per week, and we want to increase that to 3.5 diffs. Is that a good goal? Do we have a theory of improvement that would guide how we should approach the work?
I think it’s probably not a good goal, and we probably don’t have a theory of improvement, because this is an output metric (also known as a lagging metric). Output metrics are very effective at measuring if something has improved, but very bad at focusing attention towards improving that metric. Revenue is the ultimate output metric: yes, if your new product feature drives revenue, it’s accomplishing something valuable, but merely having a goal for revenue doesn’t provide any direction on how to accomplish that usefully.
That means if your developer productivity metrics are all output metrics, then you still haven’t provided a “theory of improvement” to teams trying to determine their roadmap to improve on their own metrics. (In general, lacking a theory of improvement is equivalent to not having a relevant strategy for the problem at hand.)

All of the DX Core 4 metrics are good output metrics, which allow you to evaluate your organization across dimensions to determine if you’re operating effectively, but none of them have a strong point of view on what you should do about it. This is one of the triumphs of Accelerate, which provided not only the output metrics to evaluate your organization, but also provided a set of practices that correlated highly with stronger performance.
It’s possible that providing a theory of improvement is asking too much from a batch of metrics. For example, at Carta in the past year I’ve spent a fair amount of time working with a cross-team group of engineers on improving code quality. We followed the working modeled I describe as “strategy testing”, and it took us a while to narrow in on what we believe was the ultimate problem: frontend testing support for one portion of our codebase was too challenging, and contributed to fewer frontend tests than necessary for maintaining high code quality within a complex product. It took us about three months of hypothesis forming and testing before we had confidence this was the foundational issue to focus on, and some of our earlier theories of improvement were meaningfully wrong–hence the need for strategy testing before committing to any given approach.
Perhaps the biggest win in the increasingly standardized productivity metrics are allowing developer productivity teams to shift away from the view that maintaining those metrics is their core work, and to instead recognize that refining their company’s theory of improvement for developer productivity is the much more valuable opportunity to work on instead.
Commentary on the actual metrics themselves
Taking some time to comment on the core metrics themselves, I’m reminded that there’s a Reddit thread where someone says they immediately stopped reading my first book because I suggested PRs per engineer as a bad but usable starting place for starting to understand how your engineers worked. It’s sort of funny to see that diffs per engineer is DX Core 4’s first metric.

In general, I find the core metrics to be very reasonable.
The only top-level metric I’d directly quibble with is % of time spent on new capabilities
which is a bit of a tracking nightmare in my personal experience, but it certainly
is a powerful metric if you believe it’s accurate.
There are a number of others that I haven’t seen before, but which are in retrospect obviously useful and easy to measure, such as:
Time to 10th PRis a fantastic onboarding metric, and not one that I’d considered before. In particular it’s quite easy to measure, and easy to benchmark across many different companies.R&D as a % of revenueis a foundational chart that boards like to use to evaluate you, you should be measuring yourself on it as well.
Using a synthetic/composite metric of Developer Experience Index (DXI) is both a smart move, and also an expensive one. The upside is that it allows them to include many different components into it, and to revise the composite metric over time as research evolves. For example, they could ask new questions in their surveys, and weigh them into DXI numbers calculated after the first survey including those results, and so on, without impacting the validity of their benchmarks.
The downside is that no one understands composite metrics, and it means teams will end up explaining, and explaining, and explaining what the metric means. Even then, skeptical people just don’t trust composite metrics particularly well, and both executives and boards are heavily staffed by skeptical people. That said, presenting the data within the context of a scatterplot ought to address many of the concerns about composite metrics, so it’s a reasonable experiment from my perspective.
2025+
Thinking about where the developer productivity space is today, there’s a few things that I hope are true over the next couple of years. First, I hope that framework proliferation slows down a bit. DORA, SPACE, DX Core 4 and so on are all great frameworks, but hopefully we reach a point where creating another framework is obviously not worth it. I think DX Core 4 could particularly contribute to this by emphasizing the calculation mechanism for DXI, and ensuring that access to that calculation is predictably preserved for even competitive companies to use.
Second, I’d love to see every one of my four criteria for a world-class developer meta-productivity tool move into the “product” segment of the Wardley map and entirely out of the “custom” section. That means that these tools will need to not only provide metrics collection, dashboarding, and benchmarks out-of-the-box, but they’ll also need to provide a theory of improvement. I don’t think this is out of reach, e.g. you can do a series of studies on companies that moved from low-to-high in each of the metrics and understanding what they prioritized to do so, and from that you can generate broad recommendations. Then you can work on incrementally sharpening those recommendations to be more and more directly applicable to each customer.
If that could happen, I think we reach a pretty remarkable place where developer productivity teams are primarily doer teams rather than analysis teams, which is a foundational shift from those teams’ roles in the industry today.