
Why limiting work-in-progress works.
Several years ago, my friend Bobby showed me an article about a CEO who used systems thinking to understand their company’s bottlenecks, which eventually lead to him buying out his cofounder, who had been leading their sales team. As is the case for most stories about ourselves that we decide to publish widely, this decision turned out to be the right one, and their business flourished.
I can never find that article when I want to, but it does a good job of representing one of my favorite parts of systems modeling: it’s a tool for practioners.
Recently, I used modeling to refine my thinking about our approach to reliability. This week I’ve been thinking about The Goal, how to finish more work, and what a model for productivity would look like.
The models in this post are runnable via the systems library, the Jupyter notebook generating the charts is serialized on Github, and you can interact with all of it on Binder.
An initial model
Starting simple for the first version of this model, there are an unlimited supply of ideas in the world, and we turn some of those ideas into projects. We choose to start some of those projects, and we finish some of the projects that we start.
[Ideas]  > Projects @ 1
Projects > Started  @ 1
Started  > Finished @ 1
As the model reaches equilibrium over a couple of rounds, we end up finishing one project each round.
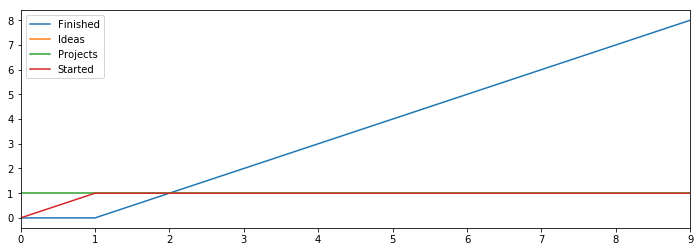
We don’t accumulate a backlog of ideas, and start projects at the same rate that we finish them.
Hire, hire, hire
Things are going pretty well, but we’re just not getting enough done, so we start hiring more developers into our company.
[Hires]  > Developers @ 1
[Ideas]  > Projects   @ Developers
Projects > Started    @ Developers
Started  > Finished   @ Developers
Each developer is able to start a project and finish a project each round, which means we’re getting more and more done, accelerating blissfully towards infinite productivity.
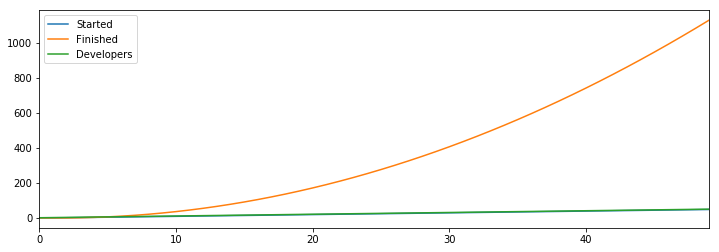
This is the dream that hypergrowth companies pursue. Take a moment to pause and rejoice for the limitless productivity that this model promises us.
Doing all the things
Unfortunately, you’ve likely noticed that when you start a bunch of projects, you actually finish fewer of them. Instead you jump from task to task, answering questions and so on, slowing down more as you have more open tasks.
We model that in by adjusting the finish rate to factor in the number of started tasks.
[Hires] > Developers @ 2
[Ideas] > Projects   @ Developers
Projects > Started   @ Developers
Started > Finished   @ Developers - Started
Now we’re starting more tasks than we can finish, and each started tasks slows down finishing of additional tasks, which causes us to quickly reach a place where we aren’t able to finish any work at all.
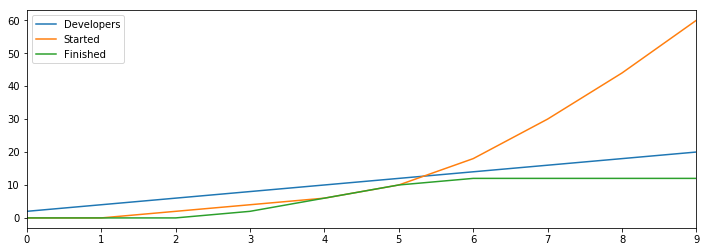
This results feels a bit extreme, but I think it’s rather common. It rarely happens so starkly in the context of smaller projects, but it happens all the time in the context of very large projects, such as migrations, where I suspect the majority of companies start more migrations than they can finish.
Limit work in progress
The classic kanban solution here is to limit work-in-progress. A new project can only be started when an existing project is finished, creating a feedback loop preventing us from overwhelming ourselves with unfinished tasks.
[Hires] > Developers @ 2
[Ideas] > Projects   @ Developers - Started
Projects > Started   @ Developers - Started
Started > Finished   @ Developers - Started
Even this fairly naive work in progress limit here creates enough feedback to allow us to continue benefiting from additional hiring. Note that the started and finished lines end up wholly overlapping after the fourth round, which is why started appears to go away.
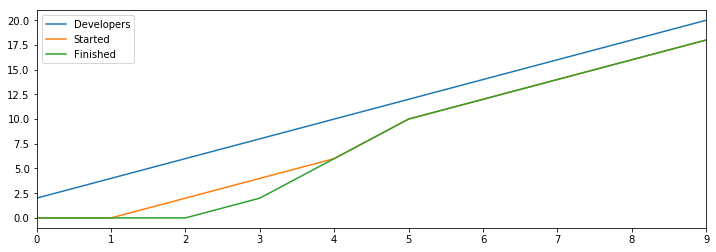
Previously, without the work-in-progress limit we only finished twelve projects in 100 rounds, but now with a work-in-progress limit we finish 198 tasks in the same 100 rounds. This is a pretty cool result, showing how starting work faster than we finish work hampers our overall throughput.
Also note, that having so much work in progress is still slowing us down quite a bit relative to optional throughput. We can experiment with this by making the back pressure on starting tasks more powerful.
[Hires] > Developers @ 2
[Ideas] > Projects   @ Developers - Started
Projects > Started   @ Developers - (2 * Started)
Started > Finished   @ Developers - Started
Now that we’re starting projects at a slower rate, we’re able to finish many, many more tasks.
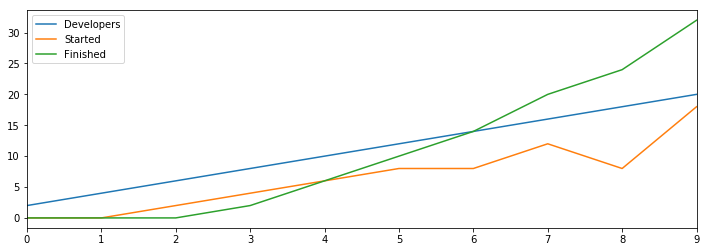
In fact, over 100 rounds, this model accomplishes 2,520 tasks, more than ten times the tasks we finished in the model with a weaker feedback loop above.
You might be curious what happens if we make the feedback even stronger and used three instead of two at the multipler against started tasks. It turns out that is too much back pressure, preventing us from starting enough tasks to saturate on finishing capacity, so we’d only finish 2064 tasks in 100 rounds. If you poke around with the parameters a bit more, you can see that we could get up to 2909 tasks if we use 1.75 as the multiplier, and so on.
Optimizing these models generally isn’t super valuable unless you’re using real-world data to define the flows, but it does do a good job of showing how much these decisions matter.
Adjusting priorities
Go a slightly different direction for a bit, it’s interesting to consider what happens when we stop some work that we’ve started without finishing it, perhaps due to a change in priorities. First incorporating it into the weak backpressure model.
Reprioritization(1)
[Hires]  > Developers @ 2
[Ideas]  > Projects   @ Developers - Started
Projects > Started    @ Developers - Started
Started  > Finished   @ Developers - Started - Reprioritization
We model in a fixed rate of project reprioritization, one per round, and remove repriortized projects from our finish rate, since we won’t finish projects we stop working on.
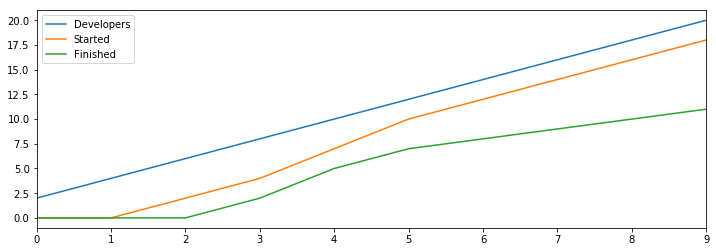
Compared to the version of this model without reprioritization, we’re still making progress, but we’ve cut our throughput in half, only finishing 101 projects over 100 rounds.
Then let’s model this against the model with strong backpressure.
Reprioritization(1)
[Hires]  > Developers @ 2
[Ideas]  > Projects   @ Developers - Started
Projects > Started   @ Developers - (2 * Started)
Started  > Finished   @ Developers - Started - Reprioritization
The rate of reprioritization is the same, but the result is quite different.
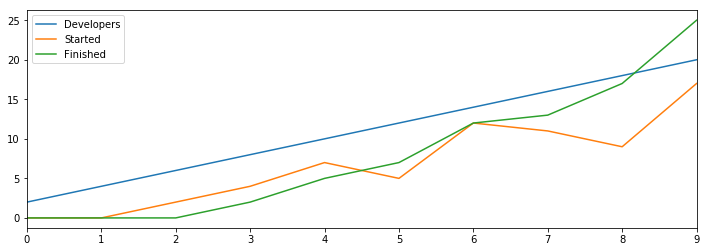
Previously we finished 2,520 tasks in 100 rounds, and with this reprioritization rate we were only able to finish 2,485, but still that’s pretty close to the same number.
Looking at both of these models together, reprioritization is very expensive in scenarios where we’re heavily constrained on execution, but fairly inexpensive in scenarios where we’re already finishing a great deal of work.
Models are just models, and they tell us what we ask them to, but for me this is another example of how models can pull folks’ intuition from the shadows into the forefront, and facilitate a rich conversation.