Extracting Data From Google Analytics Reports
A few months ago I was working on a project with the excellent J.D. Hollis, and ended up writing a simple Python script for parsing exported Google Analytics data. That particular project hit some roadblocks, but the script is sufficiently useful that I decided to go ahead and release it under the MIT license.
You can download gareports_reader.py from its GitHub repository, or you can simply download a zip of the project folder.
Justification
Sometimes you want to create custom visualizations or run custom calculations that are not provided by the Google Analytics web interface. You already can do that by downloading the data in csv, but the exported csv data set is fairly meager. On the other hand, the xml dataset is exceptionally rich, but figuring out the correct way to parse the xml to extract data can be difficult.
gareports_reader.py handles the parsing and extracting, and lets you manipulate the data in simple Python structures (lists, datetimes, and dictionaries).
Usage
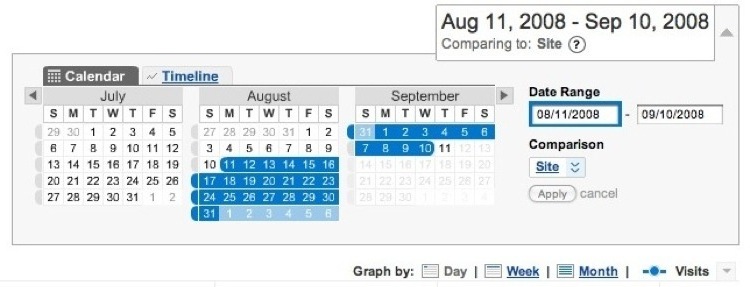
First log into Google Analytics. Then select the range of data you want to download.

Then select export, then choose the XML file format.

Now go to a folder containing both gareports_reader.py and your exported data file.
wills-macbook:gareports_reader will$ ls
Analytics_www.lethain.com_20080811-20080910_(DashboardReport).xml
LICENSE
gareports_reader.py
I tend to rename the xml file to something more typable.
mv Analytics_www.lethain.com_20080811-20080910_(DashboardReport).xml lethain.xml
Then fire up a Python interpreter (I think it runs on 2.4, but can't quite remember, and it definitely runs on 2.5).
>>> from gareports_reader import GoogleAnalyticsReportParser
>>> fin = open('lethain.xml','r')
>>> data = GoogleAnalyticsReportParser(fin.read())
>>> fin.close()
>>> dir(data)
['__class__', '__delattr__', '__dict__', '__doc__', '__getattribute__', '__hash__', '__init__', '__module__', '__new__', '__reduce__', '__reduce_ex__', '__repr__', '__setattr__', '__str__', '__weakref__', 'contents', 'dates', 'domain', 'end', 'et', 'known_report_types', 'pageviews', 'parse_dashboard', 'start', 'type']
>>> data.domain
'www.lethain.com'
>>> data.start
datetime.datetime(2008, 8, 11, 0, 0)
>>> data.end
datetime.datetime(2008, 9, 10, 0, 0)
So we can see some basic functionality there, but the real stuff is all right there in the dates field. dates is a list of chronologically sorted two-tuples (a datetime and a dictionary) which look like this:
>>> data.dates[0]
(datetime.datetime(2008, 8, 11, 0, 0), {'Search': '237.0', 'Unique': '963.0', 'Pageviews': '1100.0', 'NewVisits': '0.7579365079365079', 'AvgPageviews': '1.4550264550264551', 'Direct': '93.0', 'Visits': '756.0', 'Visitors': '690.0', 'BounceRate': '0.8293650793650794', 'NewVisitors': '0.7579365079365079', 'Referral': '426.0', 'TimeOnSite': '86.744708994709'})
So, we could create a list of pageview for each day by doing this, and then sum the total like this:
>>> pageviews = [ x[1]['Pageviews'] for x in data.dates ]
>>> reduce(lambda a,b: float(a) + float(b), pageviews)
38557.0
You could calculate the average number of pageviews as well...
>>> total = reduce(lambda a,b: float(a) + float(b), pageviews)
>>> qty = len(pageviews)
>>> total / qty
1285.2333333333333
Notice that the numbers are all stored as strings, so you'll have to convert them into floats before usage.
Anyway, gareports_reader.py makes the Google Analytics data quite accessible, so you can create the graphs and run the calculations that you're interested in.
Limitations
At the moment it only handles the Dashboard report (the report from the front page). It would be fairly simple to extend it to handle other reports, but since the front page provides an extremely rich data set (daily values for search, unique, pageviews, newvisits, avgpageviews, direct, visists, visitors, boundrate, newvisitors, referral, and timeonsite), it wasn't necessary for my purposes.
Hope it's helpful, and let me know if there are any questions.